project (03)
How to live like Yeri : Manual
As a young Journalist, I've always focused
on finding a meaning hidden within a long list of data. The data which has
found its meaning turns into a text for those who need the information that it
holds. Generative art which I encountered by chance brought a great inflection
point to my thinking as a data scientist. Statistics terminology and
terminologies from various fields that are not commonly used may not be
effectively communicated to the audience due to their technicality. On the
other hand, visual messages are sometimes much more intuitive and delivered
quickly and effectively. An even bigger advantage is that each piece of
information or number takes a unique form based on the designer’s character. As
Susan Sontag said, “Art is, now, mainly a form of thinking,” information takes
form as well as meaning through the design process. When the data that I am
handling is transformed into visual language, I find the form making process,
which turns a text into a language with more comprehensive and multidimensional
meaning, very attractive.
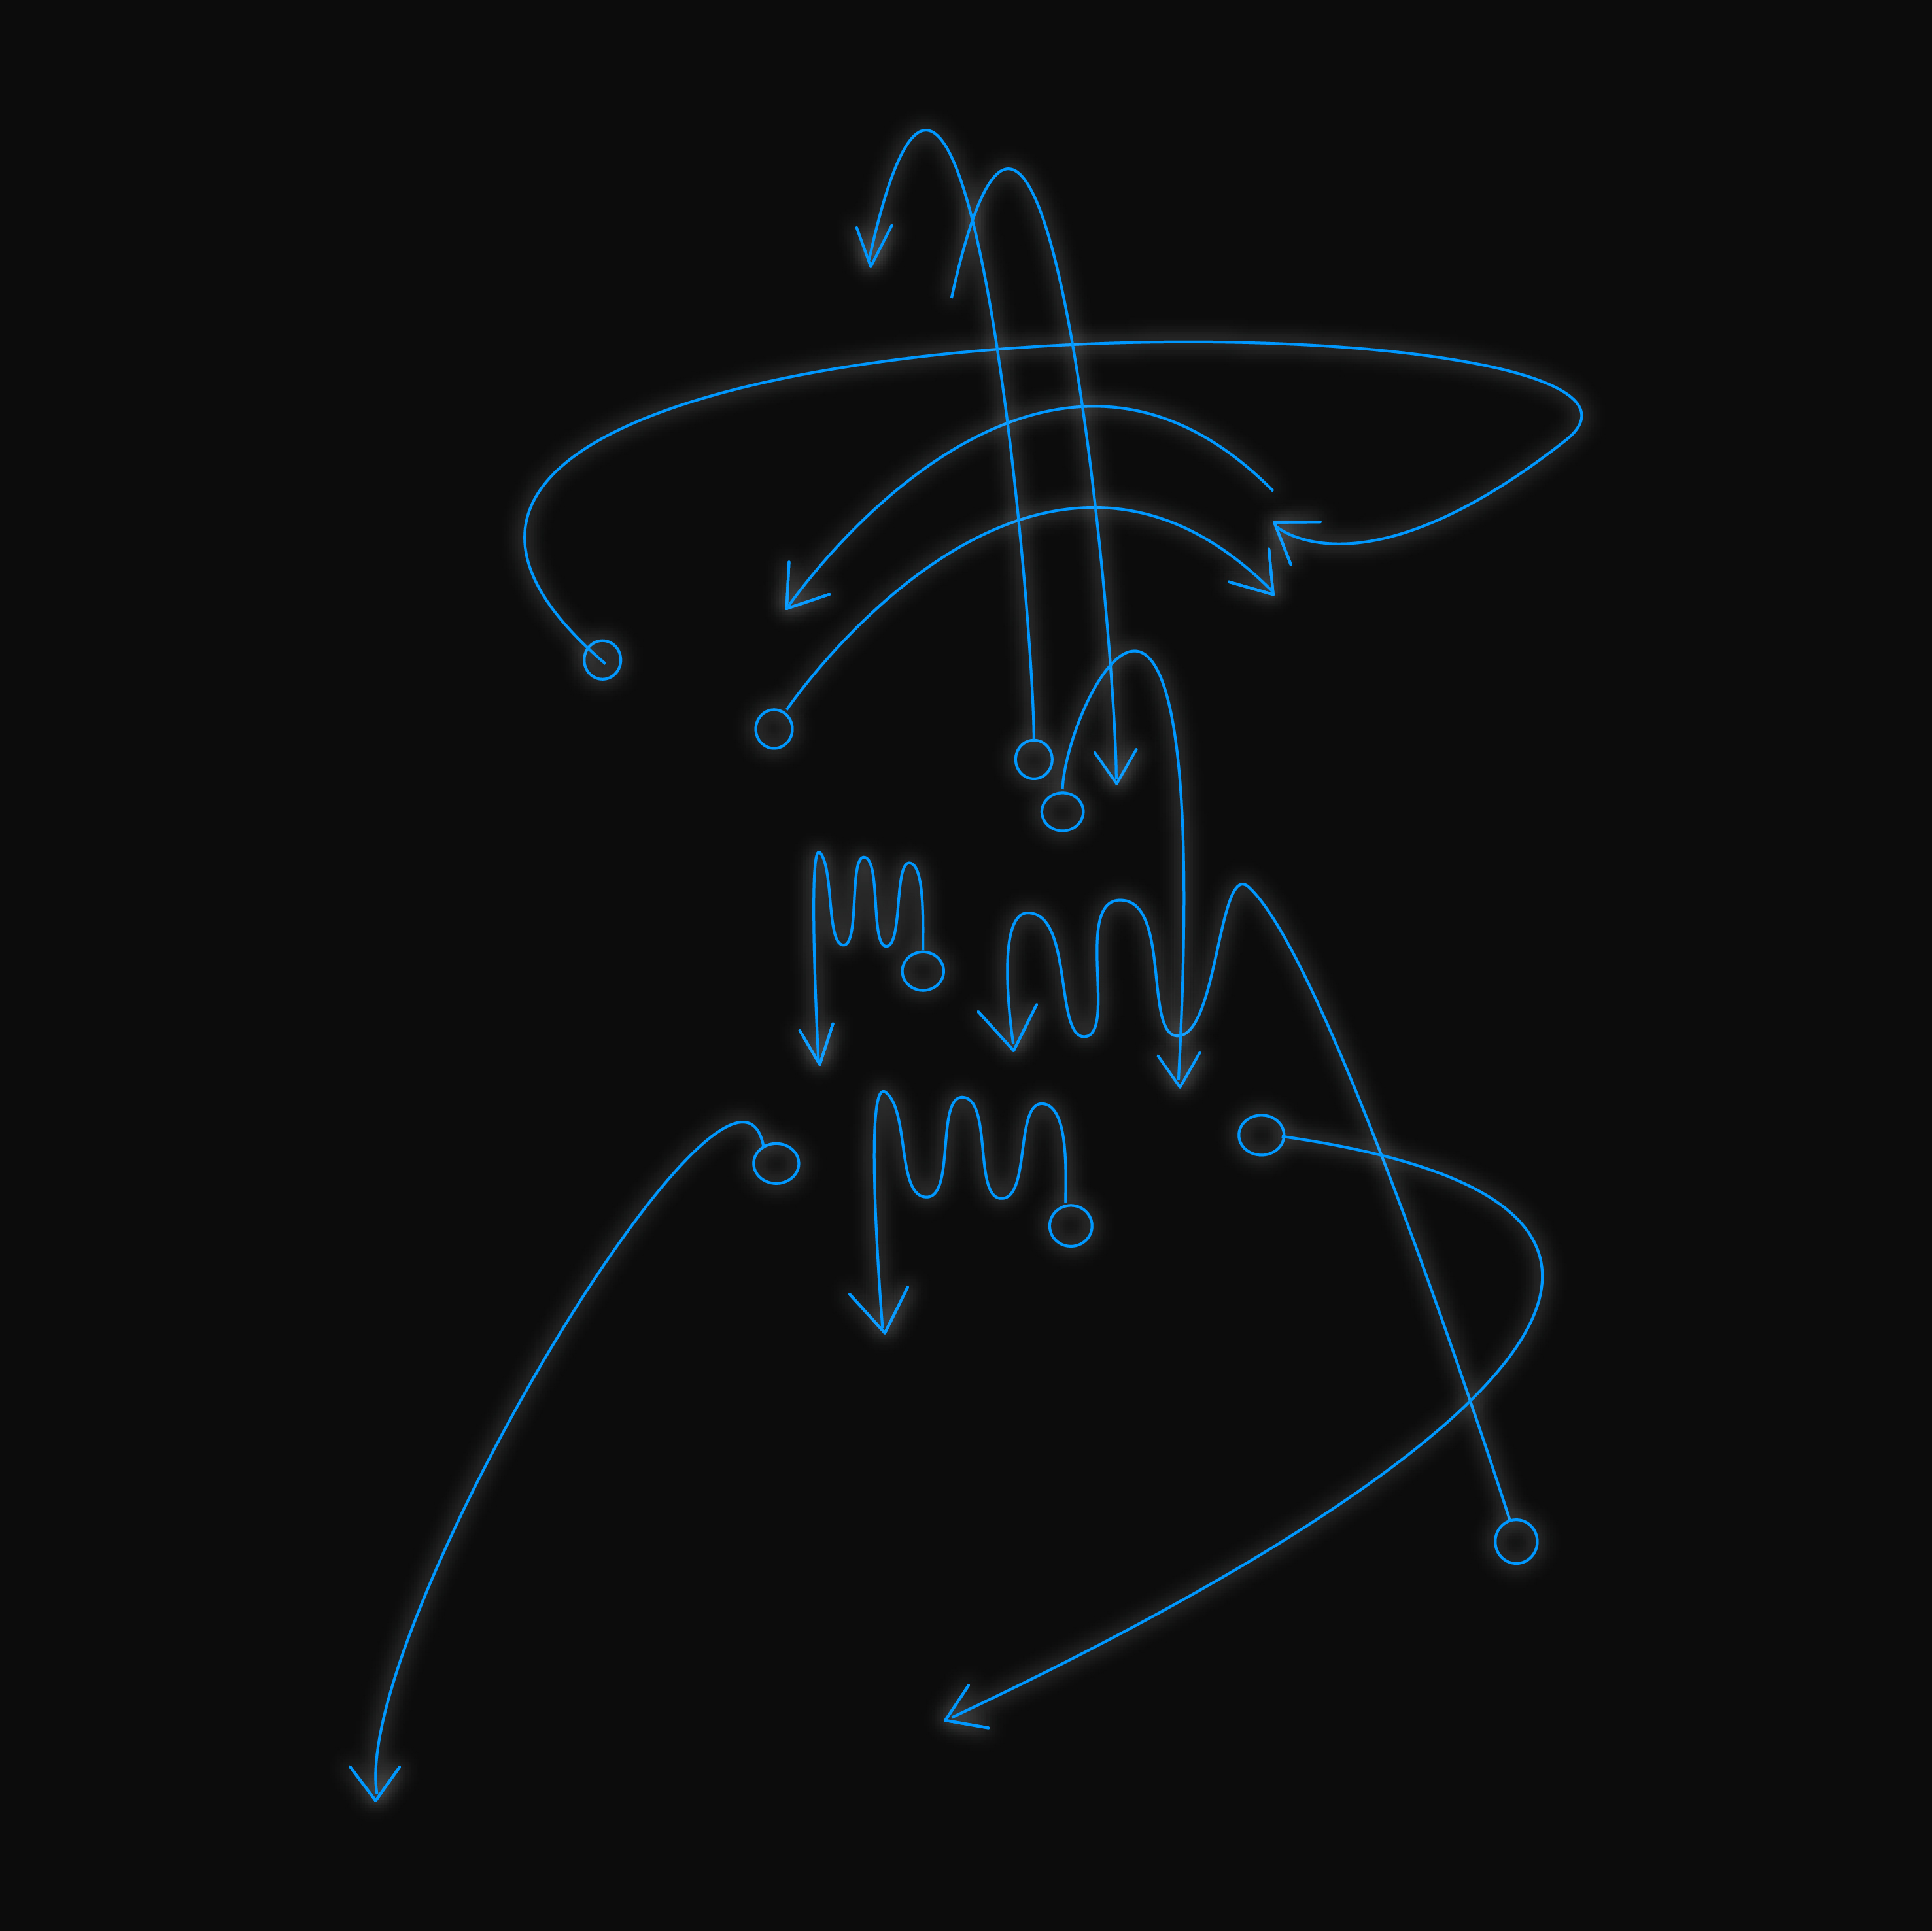
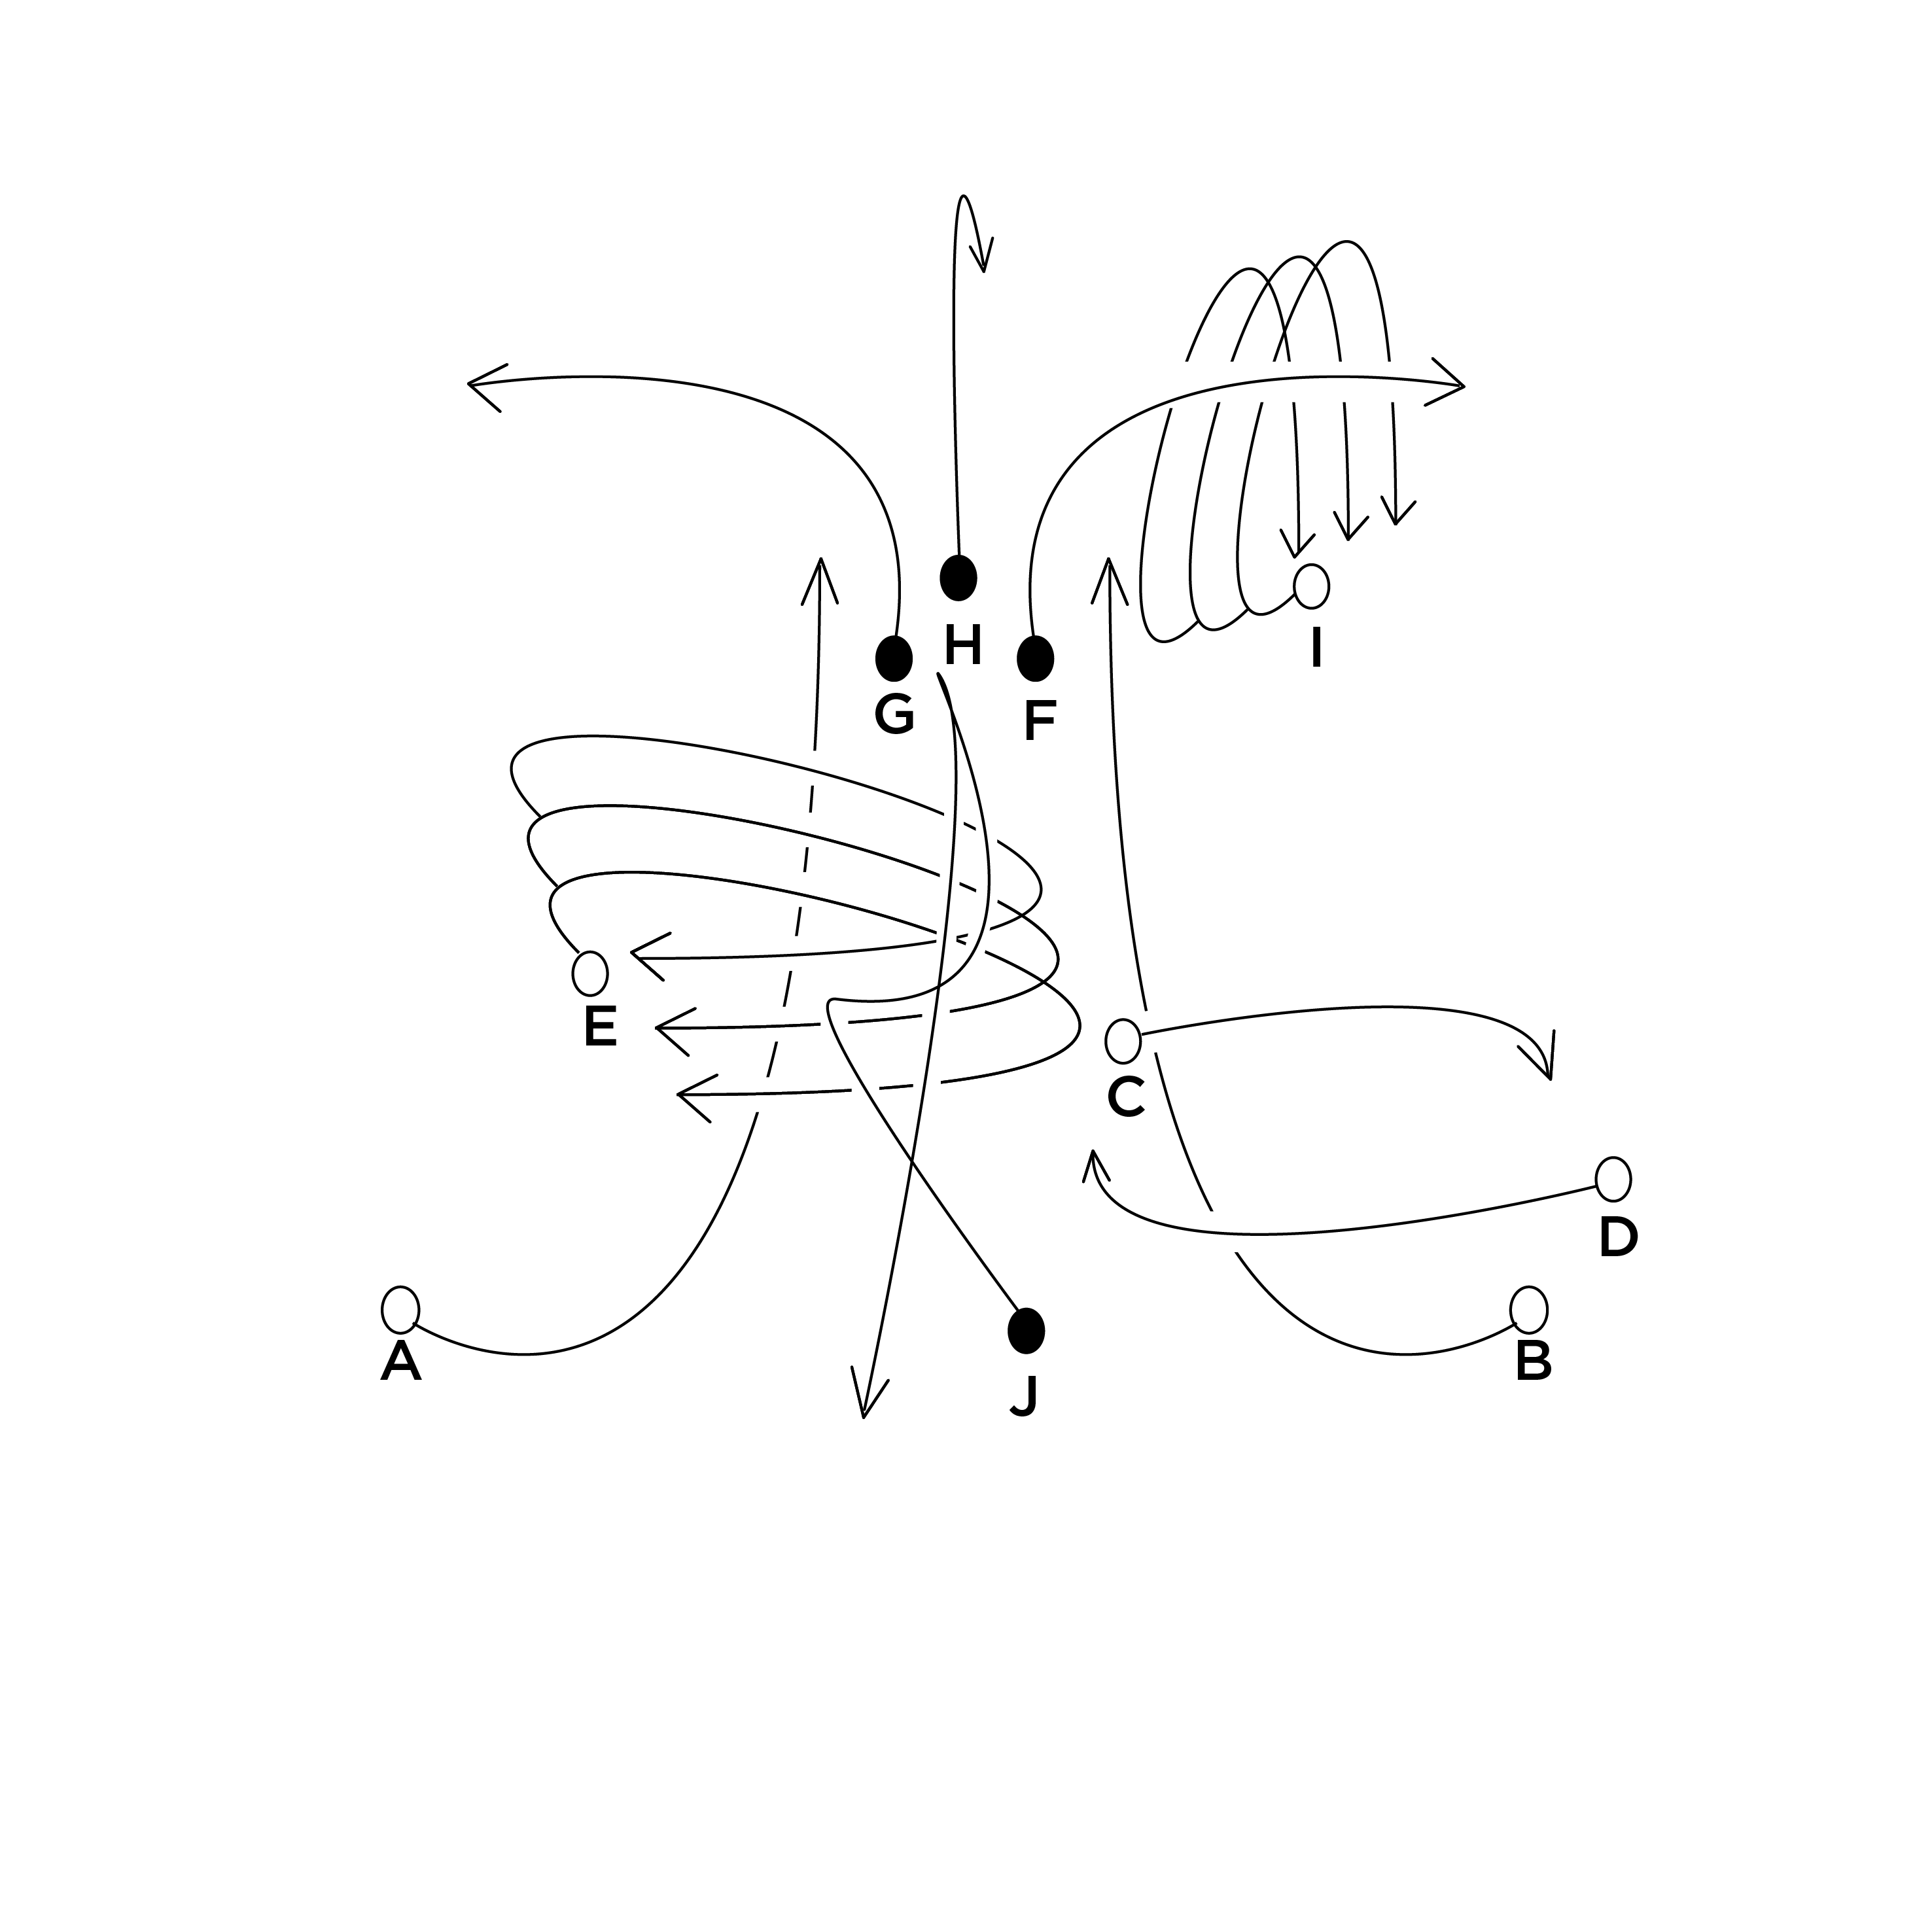
In the project, I collected the data of my behavioral pattens. All patterns are depicted from normal actions, such as eating, stretching, working out, etc.
Each movement was transformed into linear instruction, and it is a scheme of the action. As I mentioned, those visual assets became a material of another form of visual.
Action Diagram
eating instant noodle¹
![]()
![]()
eating korean traditional food²
![]()
![]()
eating fast food³
![]()
![]()
stretching after getting bored - phase one⁴
![]()
![]()
stretching after getting bored - phase two6
![]()
![]()
working out - one7
![]()
![]()
working out - two8
![]()
![]()
stretching-general9
![]()
![]()
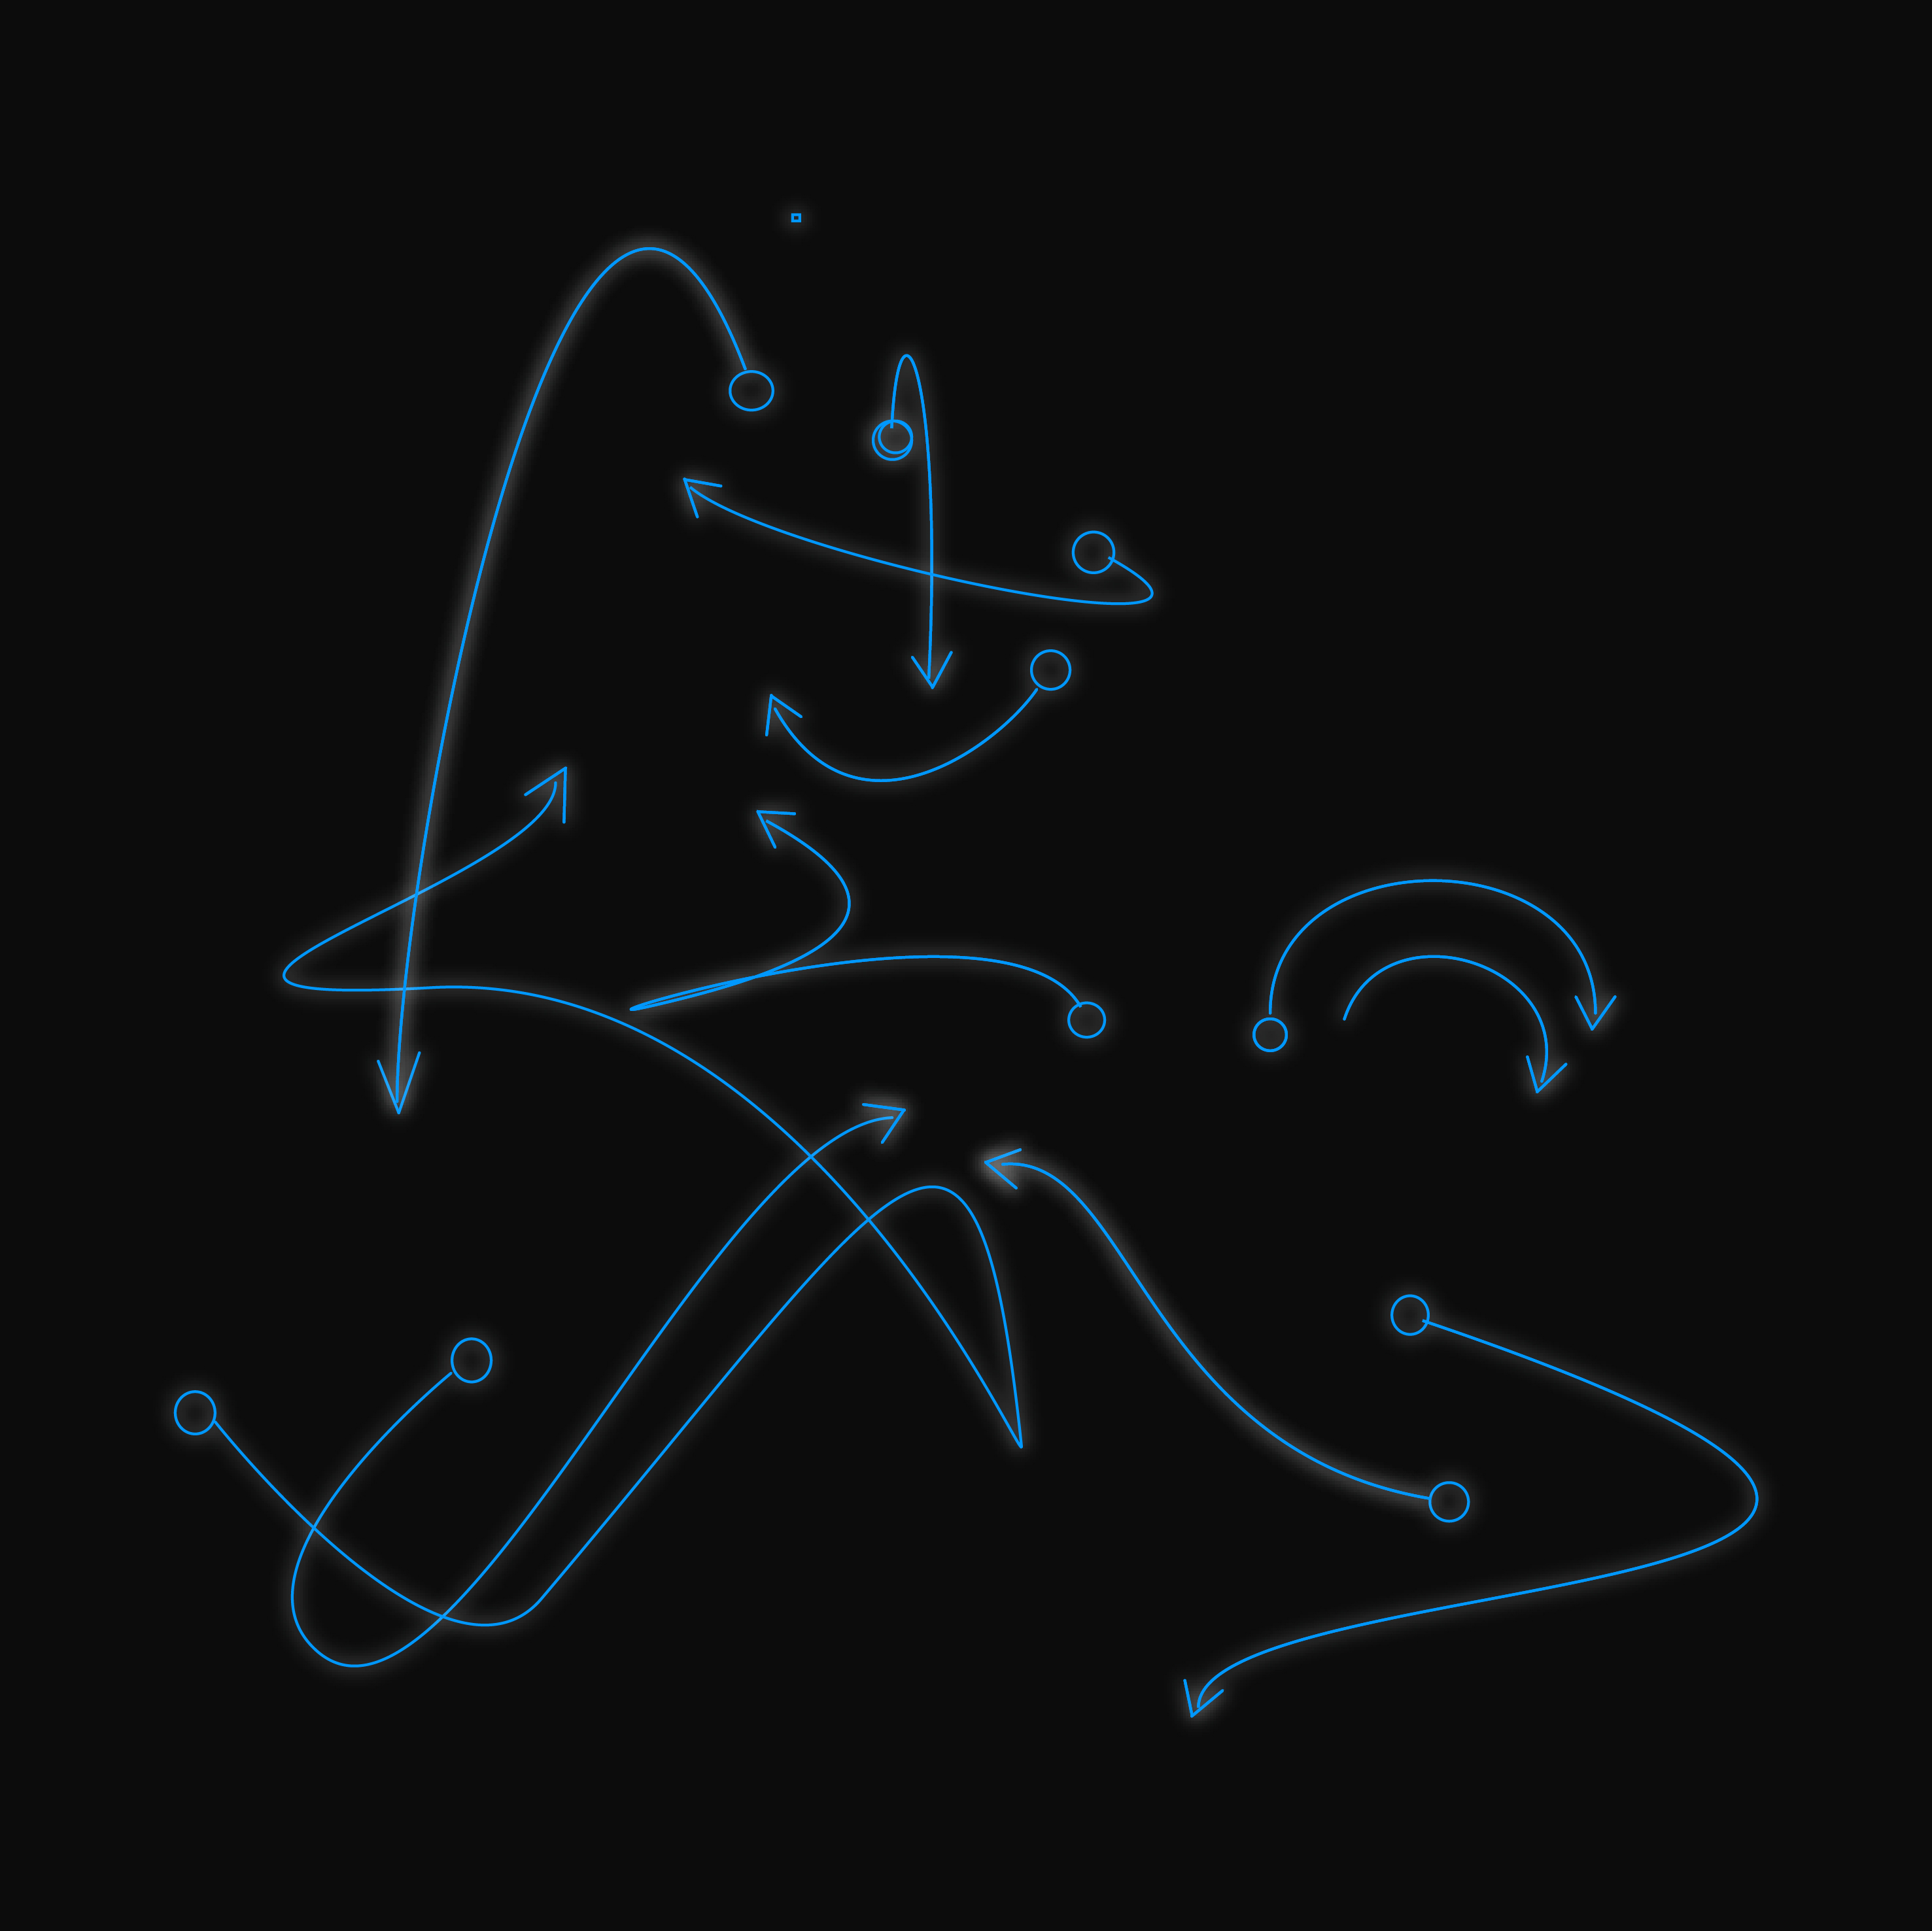
Generative visual transformation using assets
![]()
![]()
![]()
![]()
![]()
![]()
![]()
![]()
![]()
eating instant noodle¹


eating korean traditional food²


eating fast food³


stretching after getting bored - phase one⁴


stretching after getting bored - phase two6


working out - one7

working out - two8


stretching-general9


Generative visual transformation using assets